This repository hosts a script to collect event logs (wrapped around Get-WinEvents cmdlet, just made it a bit more intuitive, and created a GUI to make it even more intuitive) as well as a few PowerBI templates to help analyzing the events.
See my older docs.microsoft.com article to have an idea about how to load your CSV from this script into the PowerBI temlpate.
Right-click the below link, then "Save link as" to save the latest Launch-GetEventsGUI.ps1 script:
Download latest version of Launch-GetEventsGUI.ps1 - this branch direct raw link
This repository contains both a script to collect event logs, and a GUI that wraps around the script to make it more visual to understand and set the desired options for the collection of events (such as the number of events to collect per machine, which event log to collect from, etc...).
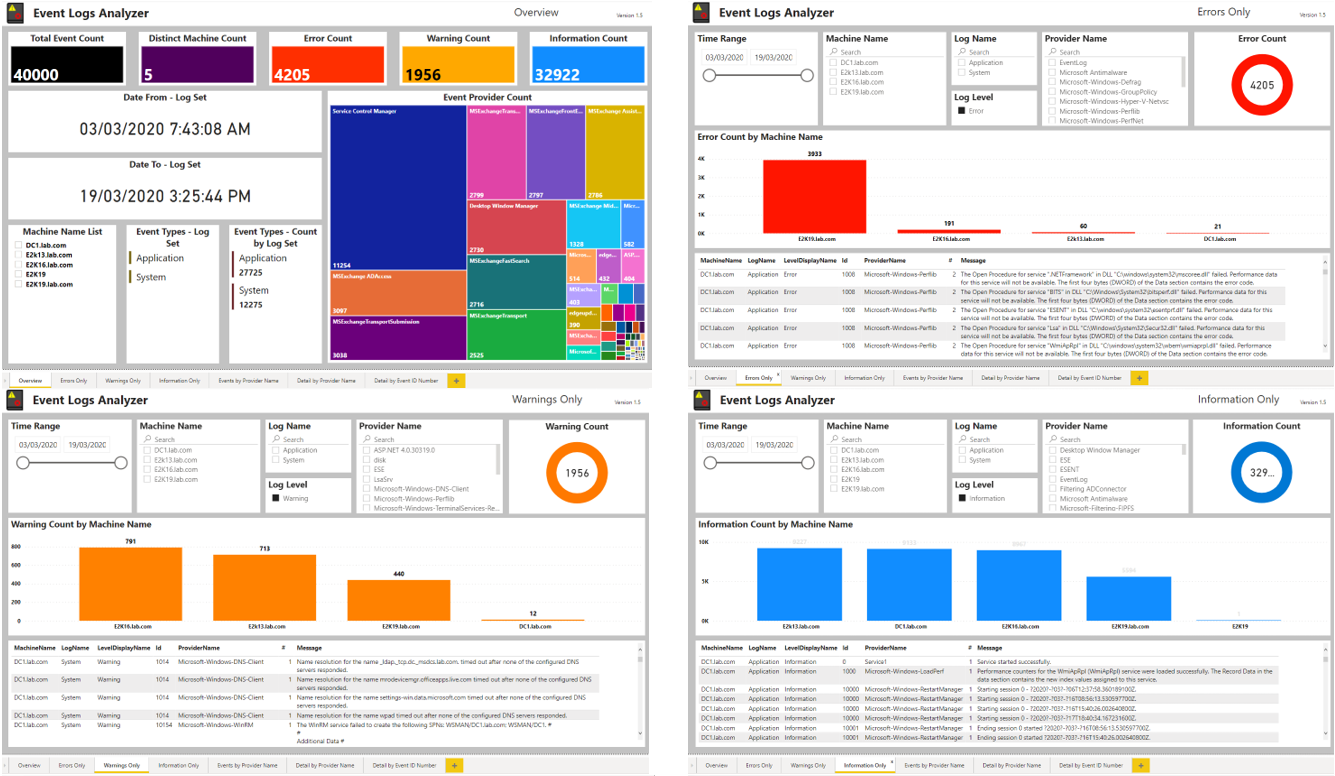
Also, as a bonus, there is a PowerBI template on which you can load the CSV that comes from the script (or the GUI) to have a visual status about the errors, warnings, etc... or about the events by category, by server...
See the blog post about both the script and the GUI there :
Get-EventsFromEventLogs.ps1 script
Event Collection Graphical User Interface
Of course, you can still use our good old but still excellent Excel to create your own graphics and statistical views about the collected CSV events.
Just a script to collect events from various sources, including the Crimson Events Channel if you know the name of these, just paste it using -EventLogName property

Using Powershell and WPF, I made a GUI to launch the events collection so that the options are easier to view before launching the collection, and you don't have to think about how to spell this or that property, and you see immediately which properties you can use with it...

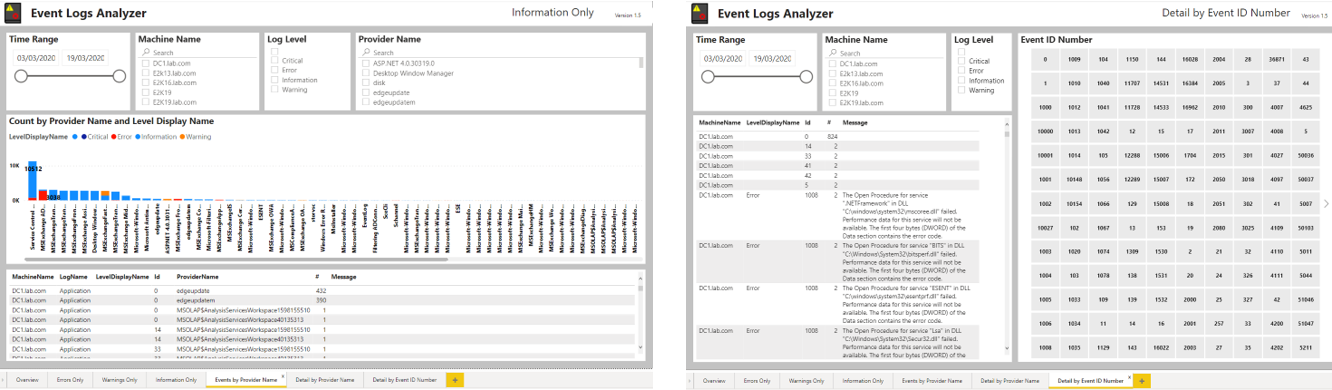
See the link on docs.microsoft.com for how to open your CSV within a PowerBI template, for now I'll just put a few screenshots to give you an idea of what each template look like.
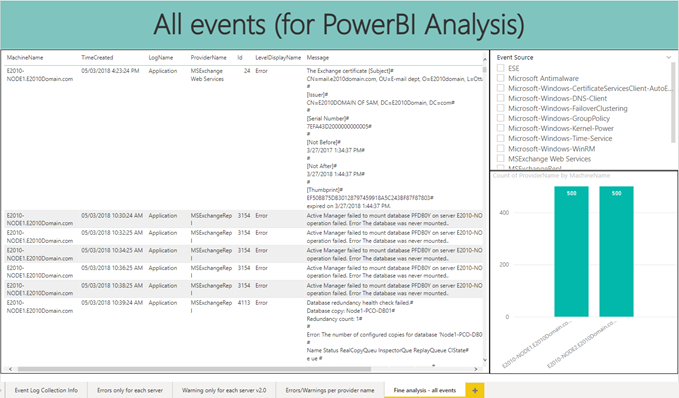
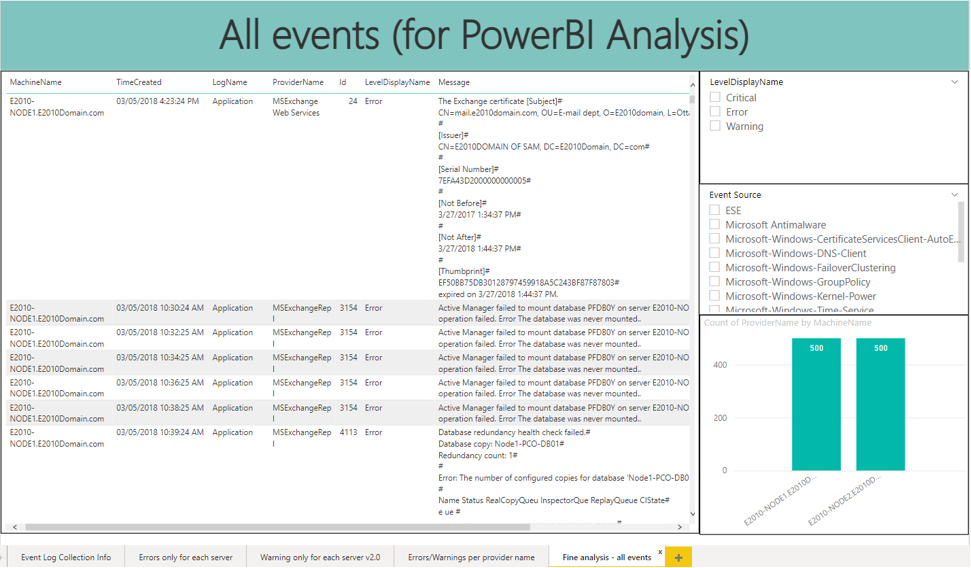
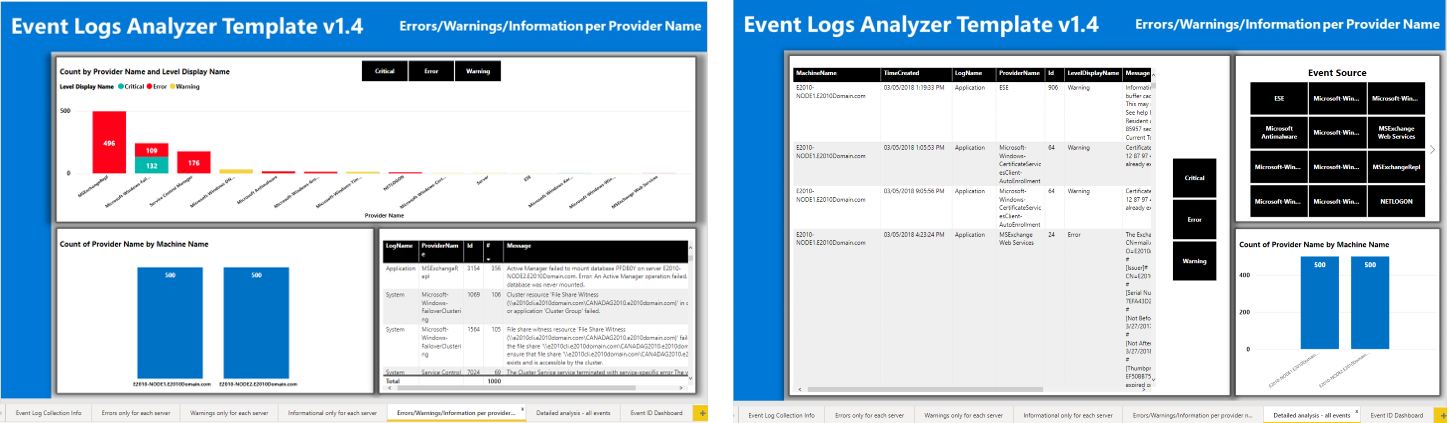
And the last tab for finer analysis (even research):
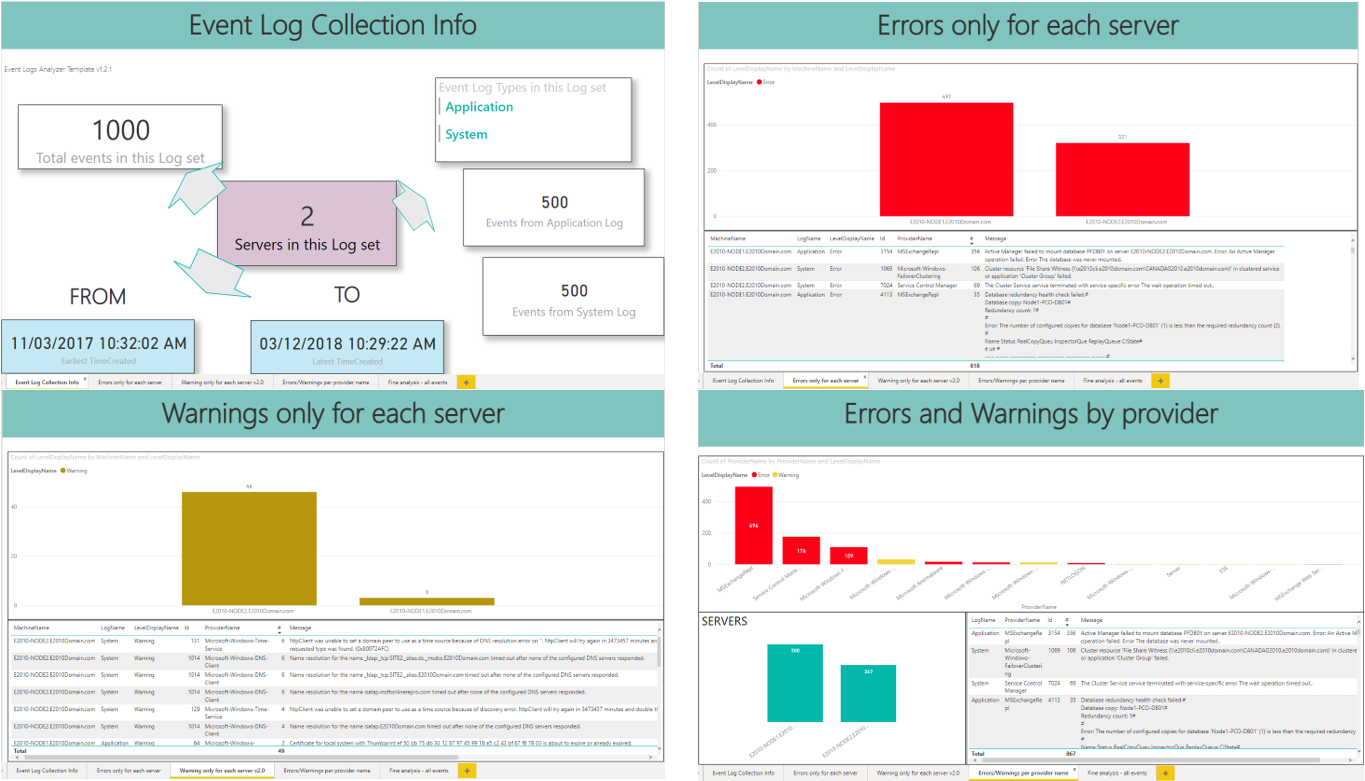
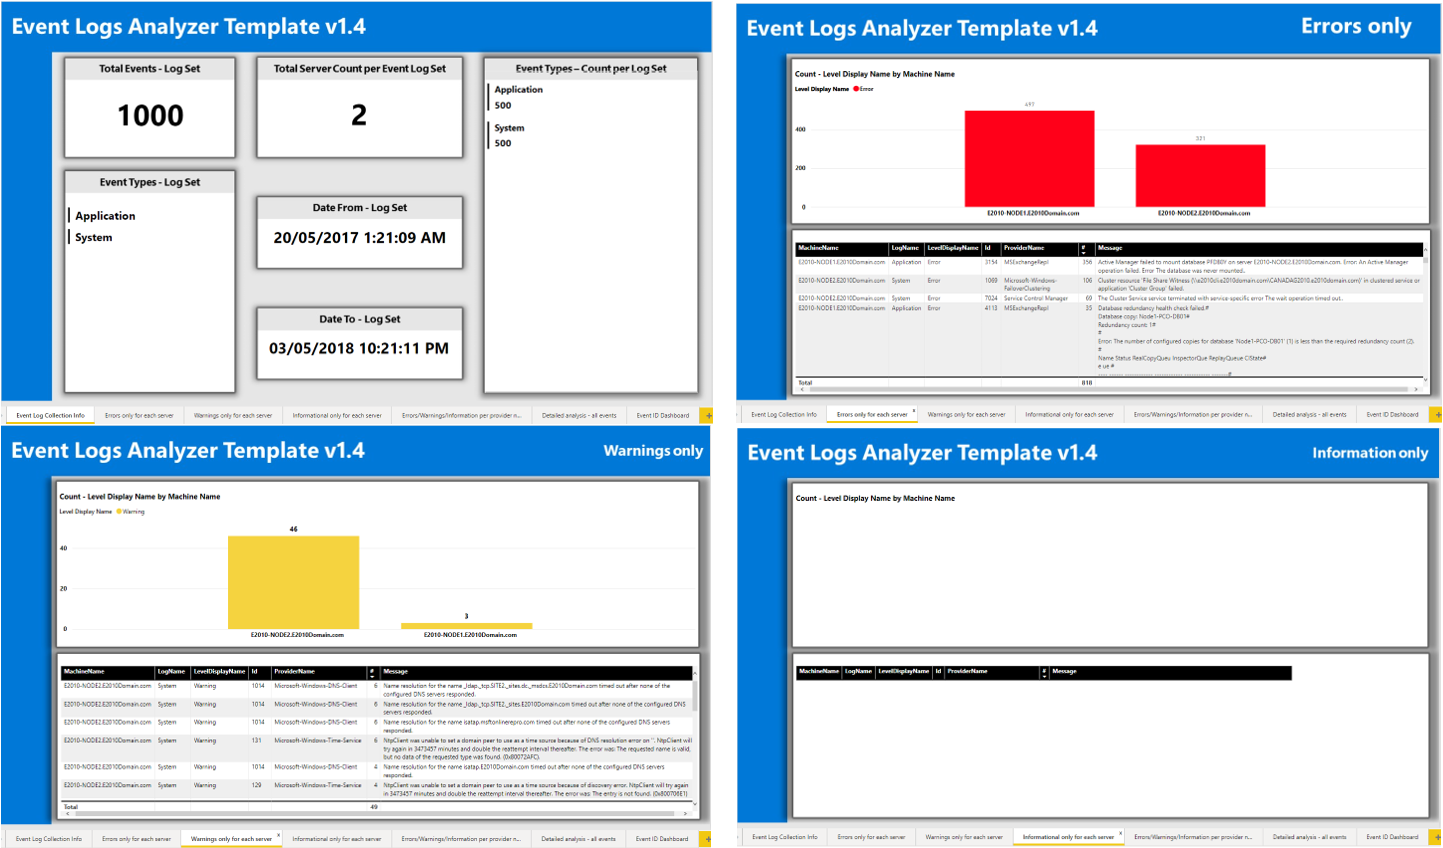
Here I made the first page cleaner than v1.2.x, and changed the orientation of some visuals as it's more readable if you have lots of servers in your CSV:
And the last tab for finer analysis is the same as v1.2.1
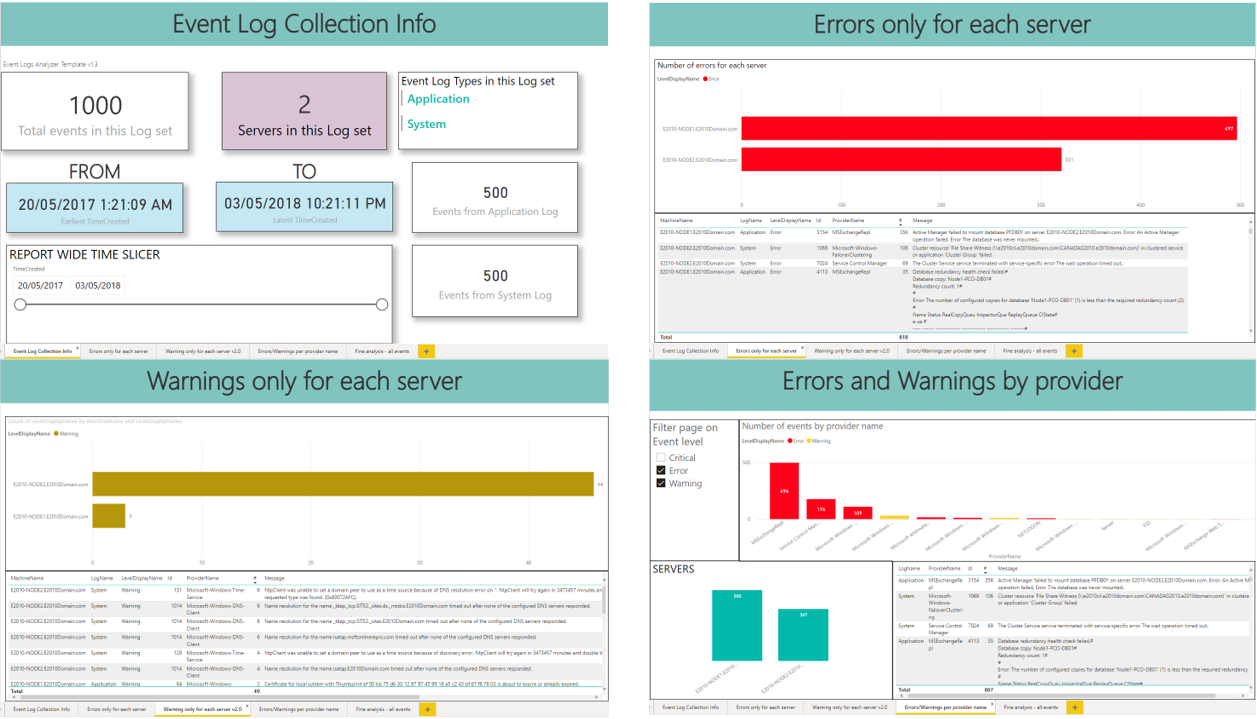
Introducing a major evolution of the above templates by my awesome, exceptionnal and passionate colleague Matthys Shoeman ! 🤗
there's more:
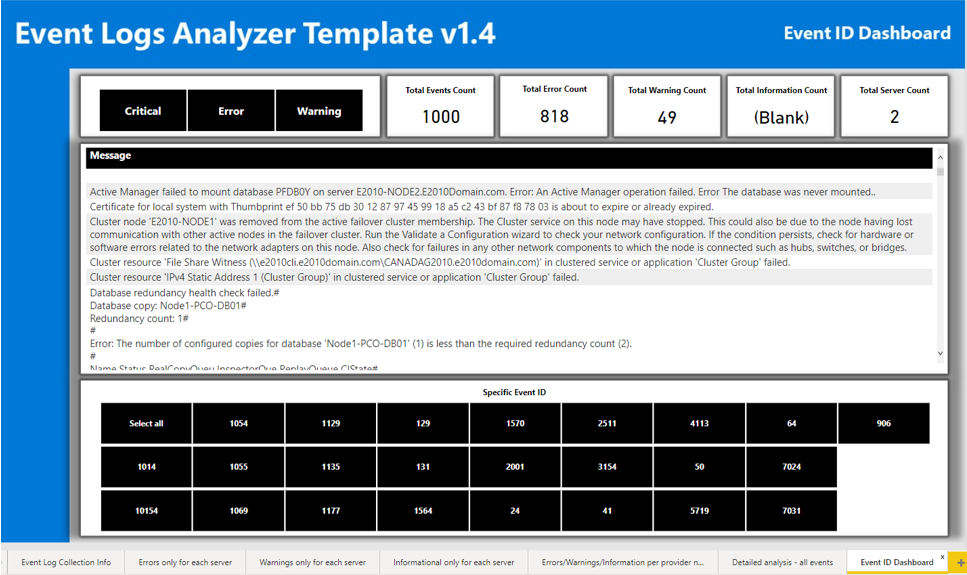
And finally a nice events dashboard:
Again, by Matthys Shoeman, an evolution of the previous template:
And: